
Հիստոգրամներն օգնում են տեսնել տվյալների հավաքածուի հաճախականության բաշխվածությունը: Հիստոգրամը ցուցադրում է թվային տվյալները՝ խմբավորելով դրանք միևնույն երկարությամբ «հատվածներում»: Յուրաքանչյուր հատվածի վրա կառուցված է սյուն, որի բարձրությունը հավասար է այդ հատվածին համապատասխանող արժեքներ ունեցող տվյալների քանակին: Հատվածները հաճախ անվանում են «միջակայքերեր» կամ «դասեր»:
The Exercises
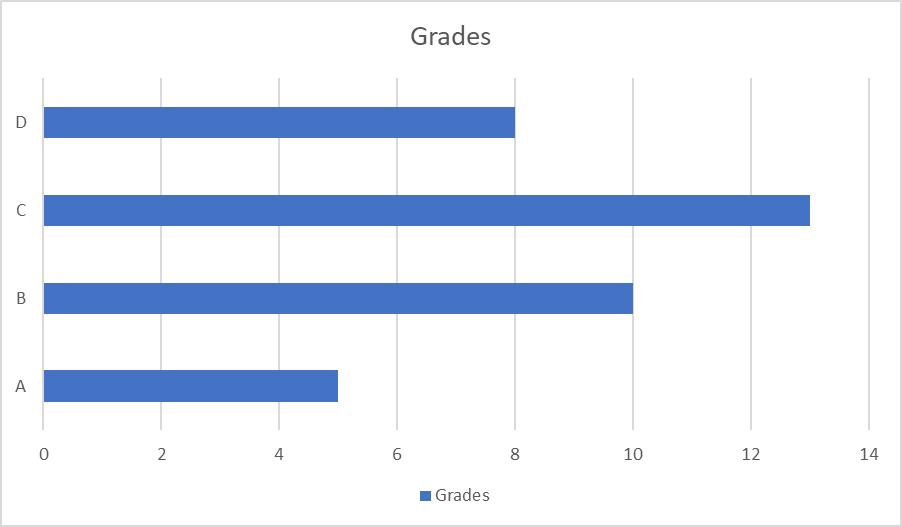
Try it #4. The stock (in kg) of grades A, B, C and D tea leaves in a store is shown in the following table.
| Grade of tea leaves | A | B | C | D |
| Mass (kg) | 5 | 10 | 13 | 8 |
a) Find the total mass of the stock of tea leaves.
5+10+13+8=36 (total mass in kg)
b) Represent the data using a bar graph. (Below)
c) Which grade of tea leaves has the lowest stock?
The A grade has the lowest stock of tea leaves (5 kg)
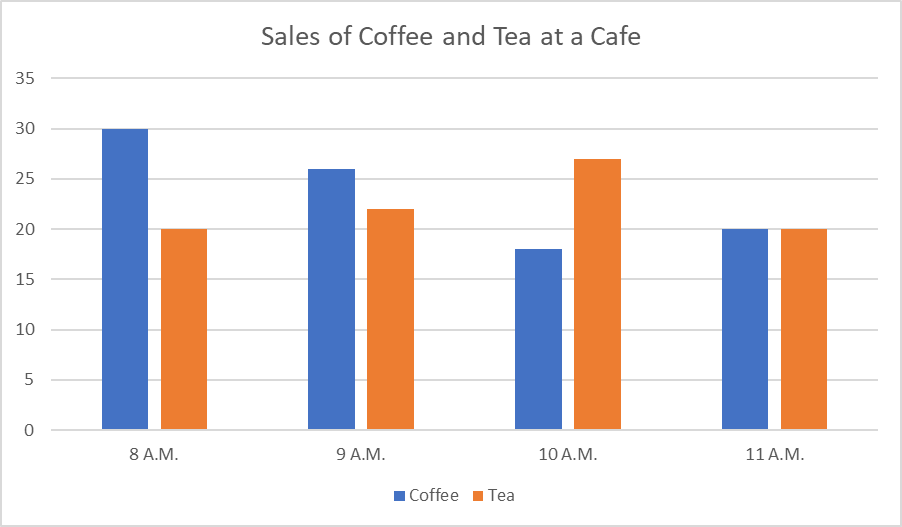
Try it #5. The bar graph shows the sales of coffee and tea at a cafe in 4 hours on a certain morning.
a) Compare the sales of coffee over the 4 hours.
30>26>20>18
30+26+18+20=94 (total coffee)
b) During which period were the sales of tea more than those of coffee?
During 10 A.M.
c) How many cups of coffee were sold during the four hours?
In total 94 cups of coffee were sold during 4 hours.
Try it #6. The following table shows the times taken by 50 students to complete a mathematics assignment.
| Time (t min) | Frequency |
| 30 < t ≤ 40 | 4 |
| 40 < t ≤ 50 | 9 |
| 50 < t ≤ 60 | 17 |
| 60 < t ≤ 70 | 12 |
| 70 < t ≤ 80 | 8 |
a) Represent the data using a histogram.
b) Describe the shape of the histogram.
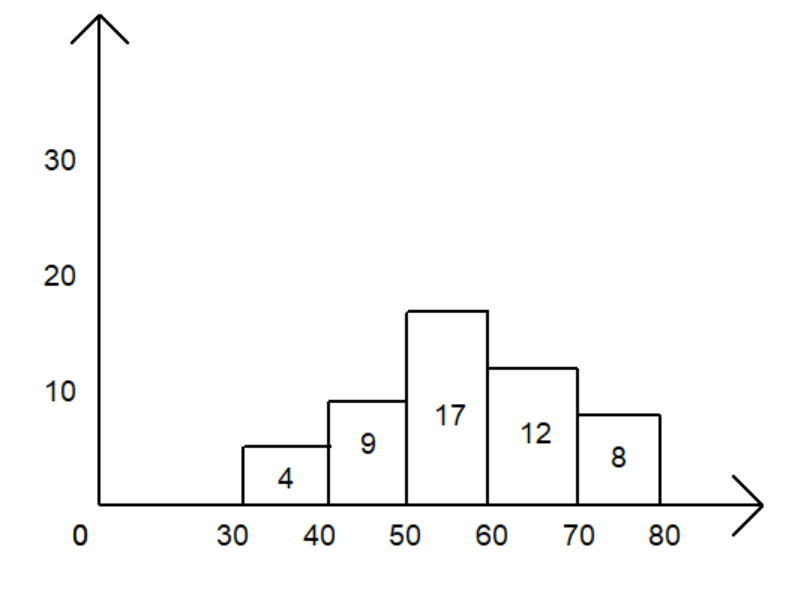
Description: The most used time lies between 50-60 min. The lowest time lies between 30-40 min. There are 4 period of times lower than period of 50-60 min.
