
Exercise #2. The masses, m grams, of 690 medical samples are given in the following table.
| Mass (m grams) | 4 ≤ m < 12 | 12 ≤ m < 24 | 24 ≤ m < 28 |
| No. medical samples (f) | 224 | 396 | p |
a. Find the value of p that appears in the table.
p=690-(224+396)=70
b. On the graph paper, draw a histogram to represent the data.
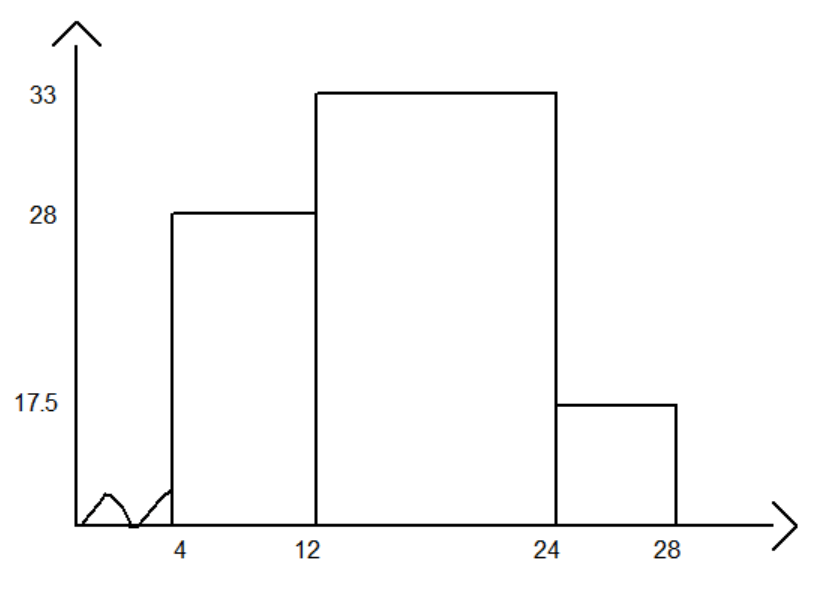
c. Calculate an estimate of the number of samples with masses between 8 and 18 grams.
The estimate number of samples with masses between 8 and 18 grams is (224:2)+(396:2)=310
Exercise #3. The table below shows the heights, in metres, of 50 boys and of 50 girls.
| Height (m) | 1.2 — | 1.3 — | 1.6 — | 1.8-1.9 |
| No. boys (f) | 7 | 11 | 26 | 6 |
| No. girls (f) | 10 | 22 | 16 | 2 |
a. How many children are between 1.3 and 1.6 metres tall?
Each class:
1.2-1.3 = 17
1.3-1.6 = 33
1.6-1.8 = 42
1.8-1.9 = 8
Frequency density:
a — 17
b — 11
c — 21
d — 8
Between 1.3 and 1.6 m tall there are 33 children.
b. Draw a histogram to represent the heights of all the boys and girls together.
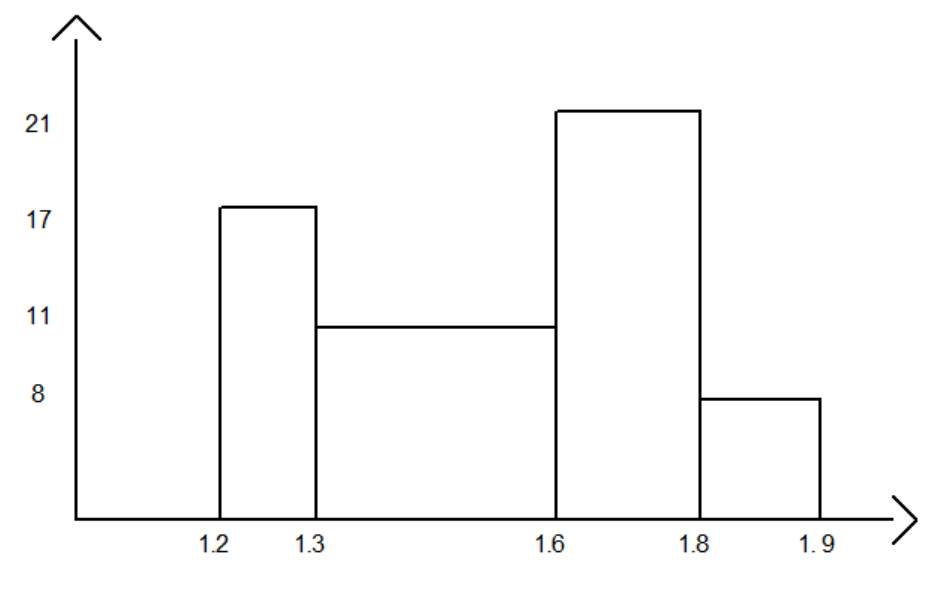
c. Estimate the number of children whose heights are 1.7 metres or more.
21+8=29 children
